Survey Highlights: 2019 Fall First-Year Student Transition to College Survey
In late October 2019, the Office of Institutional Analysis conducted a new home-grown survey: “Transition to College Survey”. All Gettysburg College first-year students were invited to participate. 86% (586 out of 679) completed the survey; the majority of them took it during their First-Year Seminar class.
The purposes of the survey were:
- to better understand first-year students’ transition to college,
- to identify (perceived) institutional strengths and challenges/growth opportunities, and
- to support data-informed institutional efforts to enhance student experience and retention.
Below are some highlights from the survey.
Meeting and Exceeding Expectations
The Survey asks: “To what extent were the expectations you brought to this institution as a first-year student matched by the reality of your experience in each of the following areas?” (Rating Scale: Well below expected--Below expected--Same as expected--Above expected--Well above expected.)
The results are very positive. Over 90% of our first-year students reported their expectations have been met or exceeded in the nine areas shown in the chart below (listed in descending order based on the combined % of “Same as expected”, “Above expected”, and “Well above expected”). In particular, close to 60% reported their expectations have been exceeded in terms of quality of interactions with faculty, and level of respect and acceptance shown by faculty and staff towards students.
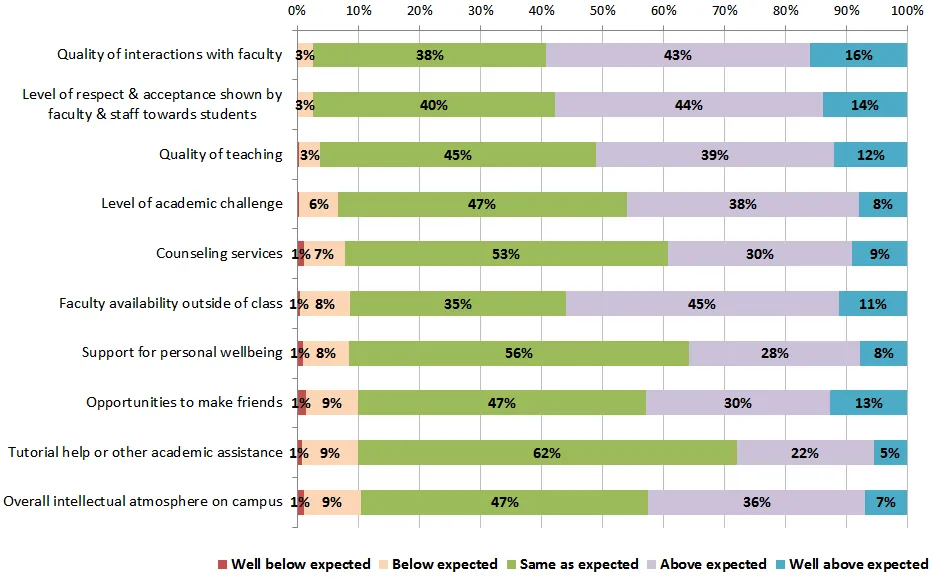
| Survey Item | Well below expected | Below expected | Same as expected | Above expected | Well above expected | Combined % of Same as, Above, and Well above expected |
|---|---|---|---|---|---|---|
| Quality of interactions with faculty | 0.0% | 3% | 38% | 43% | 16% | 97% |
| Level of respect and acceptance shown by faculty and staff towards students | 0.0% | 3% | 40% | 44% | 14% | 97% |
| Quality of teaching | 0.3% | 3% | 45% | 39% | 12% | 96% |
| Level of academic challenge | 0.3% | 6% | 47% | 38% | 8% | 93% |
| Counseling services | 1% | 7% | 53% | 30% | 9% | 92% |
| Support for personal well-being | 1% | 8% | 56% | 28% | 8% | 91% |
| Faculty availability outside of class | 1% | 8% | 35% | 45% | 11% | 91% |
| Opportunities to make friends | 1% | 9% | 47% | 30% | 13% | 90% |
| Tutorial help or other academic assistance | 1% | 9% | 62% | 22% | 5% | 90% |
The Survey also asks about student wellbeing during their transition to college. It is worth noting that less than half of the respondents reported that they were getting enough sleep, or felt rested most of the time. The chart below shows student responses in the four areas of personal wellbeing.
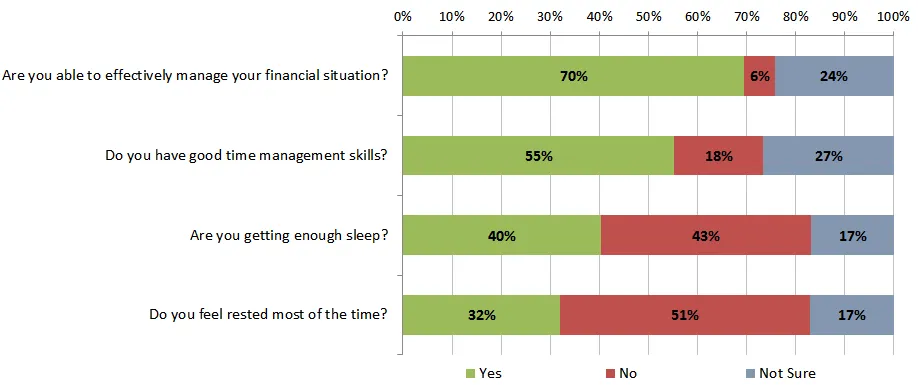
| Question | Yes | No | Not Sure |
|---|---|---|---|
| Are you able to effectively manage your financial situation? | 70% | 6% | 24% |
| Do you have good time management skills? | 55% | 18% | 27% |
| Are you getting enough sleep? | 40% | 43% | 17% |
| Do you feel rested most of the time? | 32% | 51% | 17% |
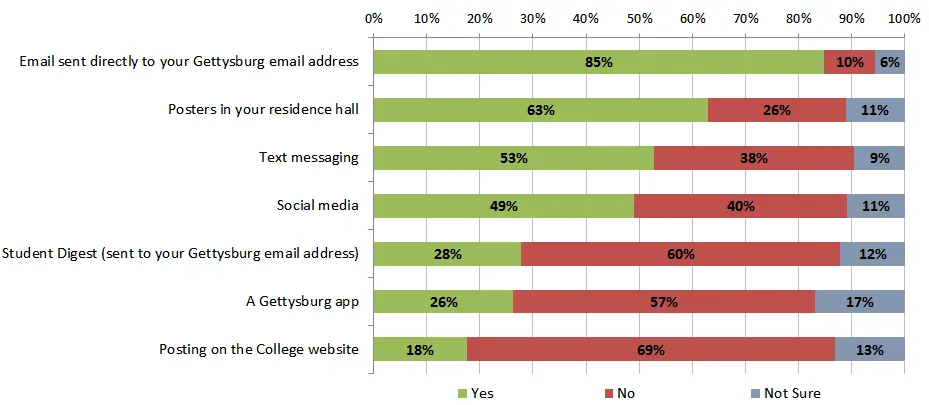
Preferred Ways of Getting Notified
Survey Question: “What is your preferred way of getting notified of campus events and resources?” The chart below shows the % of students who selected each.